How unusual is current post-El Niño warmth?
Posted on 11 December 2024 by Zeke Hausfather
This is a re-post from The Climate Brink
As I noted a few months back, despite the end of El Niño conditions in May, global temperatures have remained worryingly elevated. This raises the question of whether this reflects unusual El Niño behavior, or a more persistent change in the underlying climate forcings or feedbacks.
At the time I did a fairly basic analysis comparing the current 2023/2024 El Niño event to the two other recent strong El Niño events – those in 1997/1998 and 2015/2016. However, an “N” of two does not tell us all that much, and the approach was overly simplified in not actually accounting for differing El Niño timing or accurately normalizing for the warming between El Niño events.
So I decided a more thorough analysis was in order, looking at the evolution of daily temperatures across all El Niño events using the ERA5 reanalysis dataset. Given that this dataset covers the period from 1940 to present, it gives us a six strong El Niño events (Niño 3.4 region > 1.8C) and four more moderate El Niño events (Niño 3.4 region > 1.5C and < 1.8C) to compare with what is happening this year.
It turns out that even looking at the longer record, the evolution of global surface temperatures both before and after the El Niño is unprecedented: temperatures rose earlier than we’ve seen before, and temperatures have remained at elevated levels for a longer period of time.
To isolate the effect of El Niño events on surface temperatures we first need to remove an important confounding component: the effect of human emissions of CO2 and other greenhouse gases (and aerosols) on global mean surface temperatures.
The figure below shows the approach I used, which involved fitting a locally linear regression (LOWESS) to ERA5 daily temperature anomalies between 1940 and present. This approach is more flexible than a simple linear fit, as it allows for changes in the rate of warming over the course of the record: slow warming pre-1970, faster warming between 1970 and 2005, and a modest acceleration in the rate of warming after 2005.
Next I set a threshold for a El Niño events that are large enough to use for comparison. Initially I started with strong El Niño events, defined as those with an Niño 3.4 index above 1.8C (using 2C as a threshold, which is a bit more common as a definition of a strong El Niño, gives the same list of events with the exception of 2009).
Finally, I plotted the detrended temperatures both 12 months before and 12 months after the peak of each El Niño event. I somewhat arbitrarily required an El Niño peak to be unique to a particular 12-month period; e.g. specifying that you cannot have two El Niño events within 12 months of each other to avoid double counting individual El Niños.
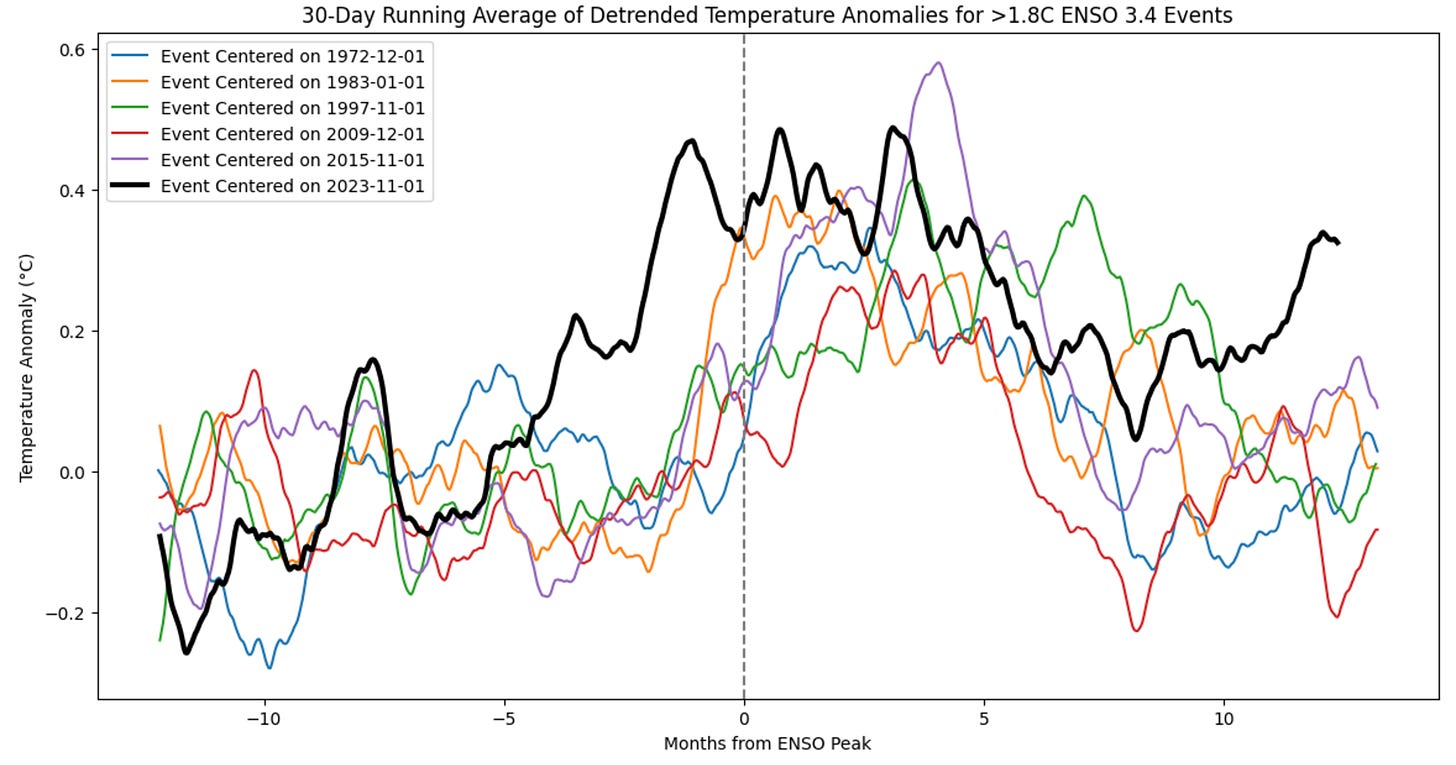
The figure above shows the results for strong El Niño events. Here we see that the heat in 2023 (solid black line) emerged earlier than in any other strong El Niño. The peak temperatures were similar to other events in 2015/2016 and 1997/1998 – at around 0.4C above “normal” global surface temperatures – and global temperatures fell a bit after April in-line with prior El Niño events.
However, since October global temperatures have remained elevated despite El Niño conditions being long gone, putting the latter part of 2024 firmly outside the range experienced during any other strong El Niño.
We can also show the current event compared to the mean and two-sigma range of other strong El Niño events, as shown in the figure below. However, some caution is warrented in interpreting the uncertainty range given the relatively small number (five, excluding the current one) of strong El Niños since 1940.
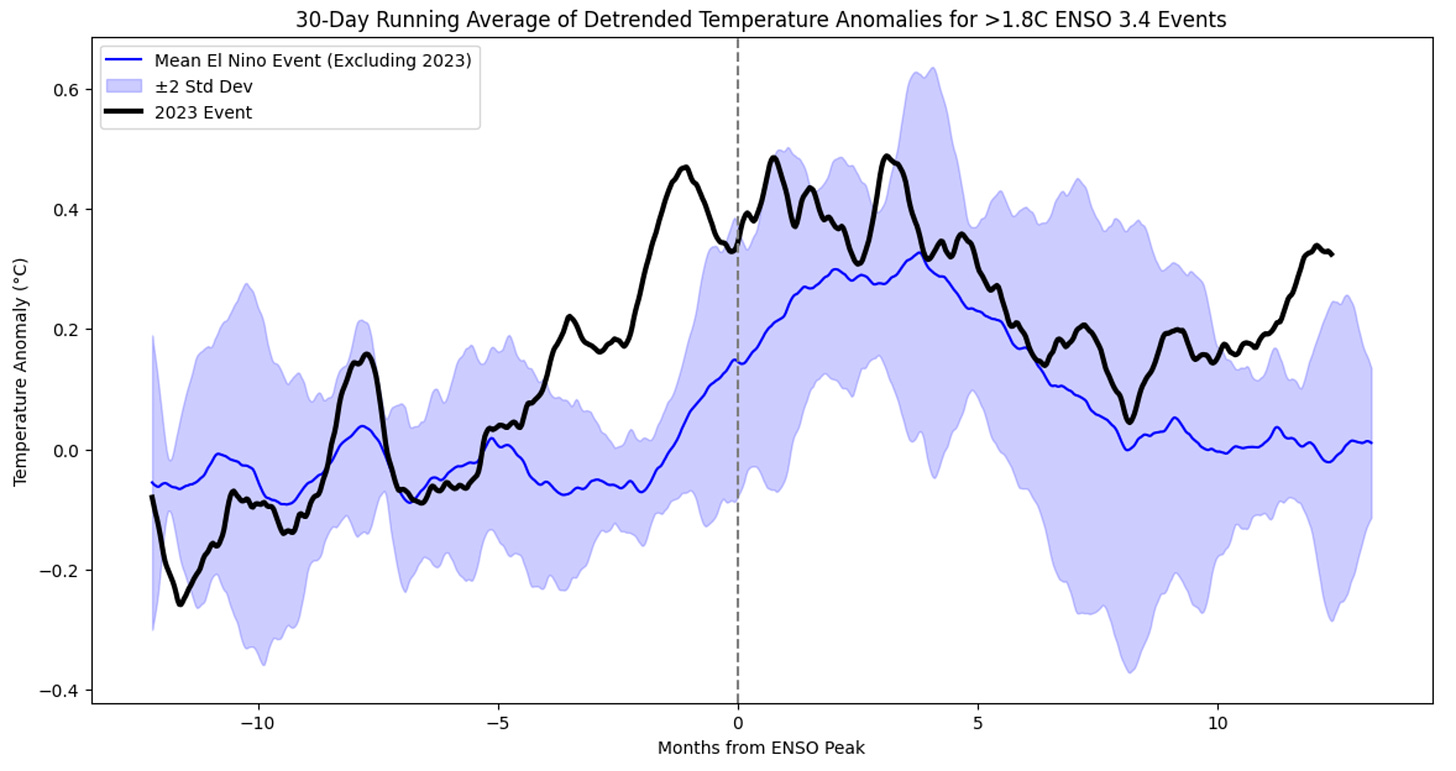
In general, whenever there is a strong El Niño event, the global surface temperature response is at between around 0.2C and 0.4C above normal in the five months following the event, with the peak response between 2 and 4 months following peak Niño 3.4 index conditions in the tropical Pacific.
Its clear that the current spike in global surface temperatures both started earlier and persisted longer than in other strong El Niño events since 1940. But El Niño is not the only factor at play here; could there be other forms of internal variability leading to either the early spike in temperatures or the current persistence of high temperatures that might not have happened in past strong events?
To try and answer this we can expand the range of El Nino events to look at more moderate (Niño 3.4 index > 1.5C) ones. The figure below shows the current event compared to nine other moderate to strong events that the world has experienced since 1940.
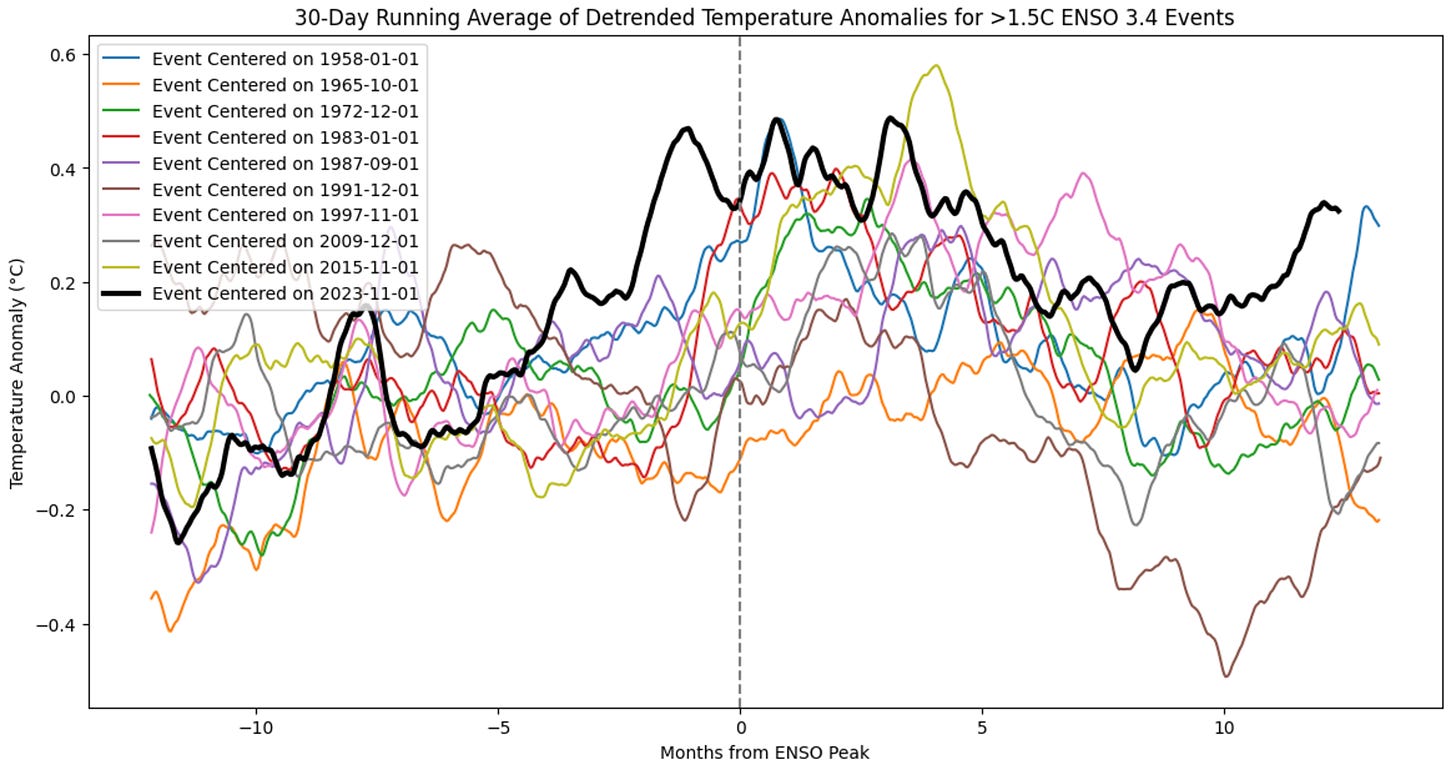
Here we do see a short-lived spike in global temperatures approximately 12 months after the end of an El Niño event that occurred in December 1958. This at least suggests that the current persistence of warm conditions might be driven at least in part by short-term natural variability; whether or not temperatures remain elevated or fall back down in the next few months will tell us a lot about how unprecedented the persistence of warmth has been during this event.
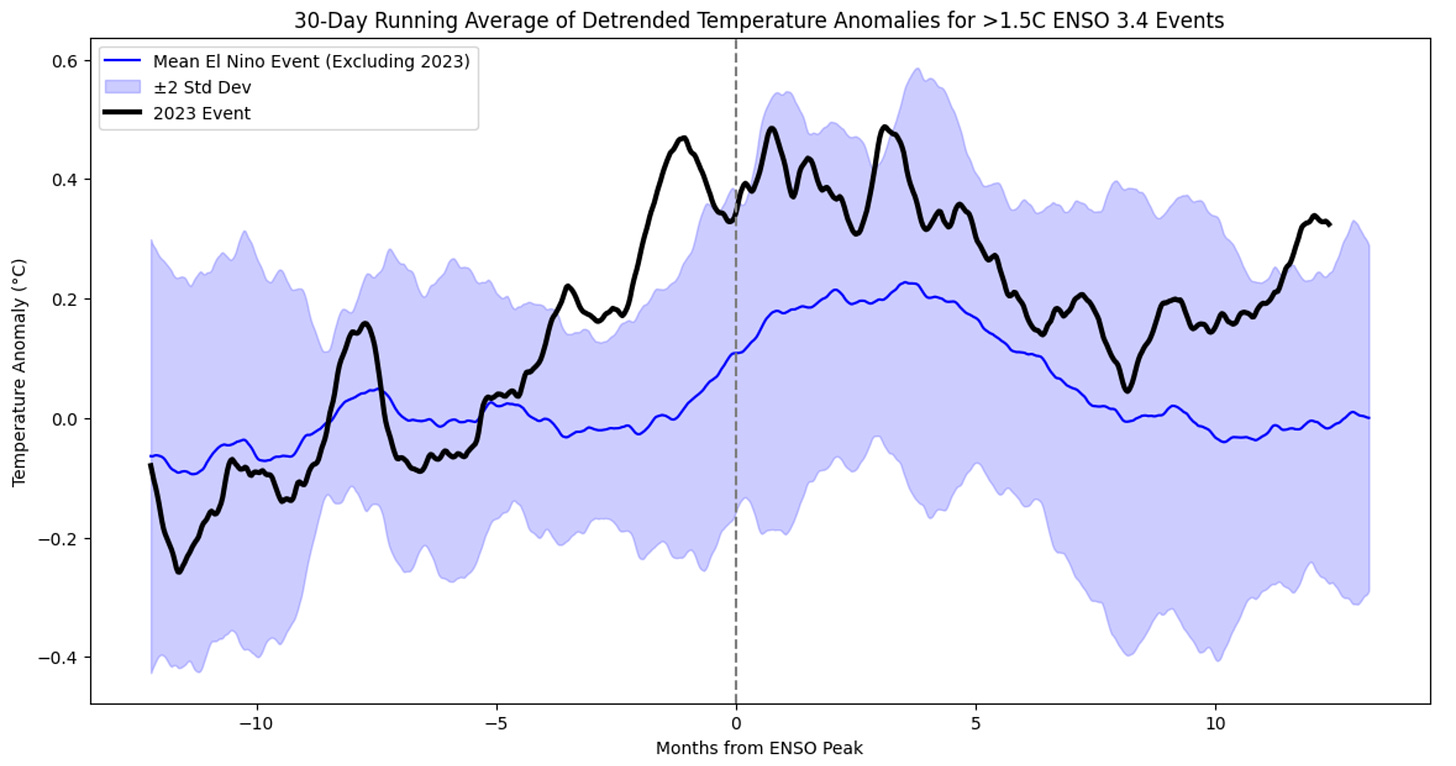
We can also look at the mean and uncertainty in global temperature response to more moderate El Niño events, as shown in the figure above. Here we see a mean response of 0.2C to these events, with peak global surface temperature response between two and four months after the El Niño peak. The uncertainties are much wider – ranging from 0C to 0.5C – reflecting the larger sample size and inclusion of more moderate El Niño events.
Finally, we can look at even weaker El Niño events (Niño 3.4 index > 1C), which gives us 19 different El Niño events since 1940 (18 excluding the current one). While this somewhat increases the uncertainty, it does not change the picture of how anomalous the current event is.
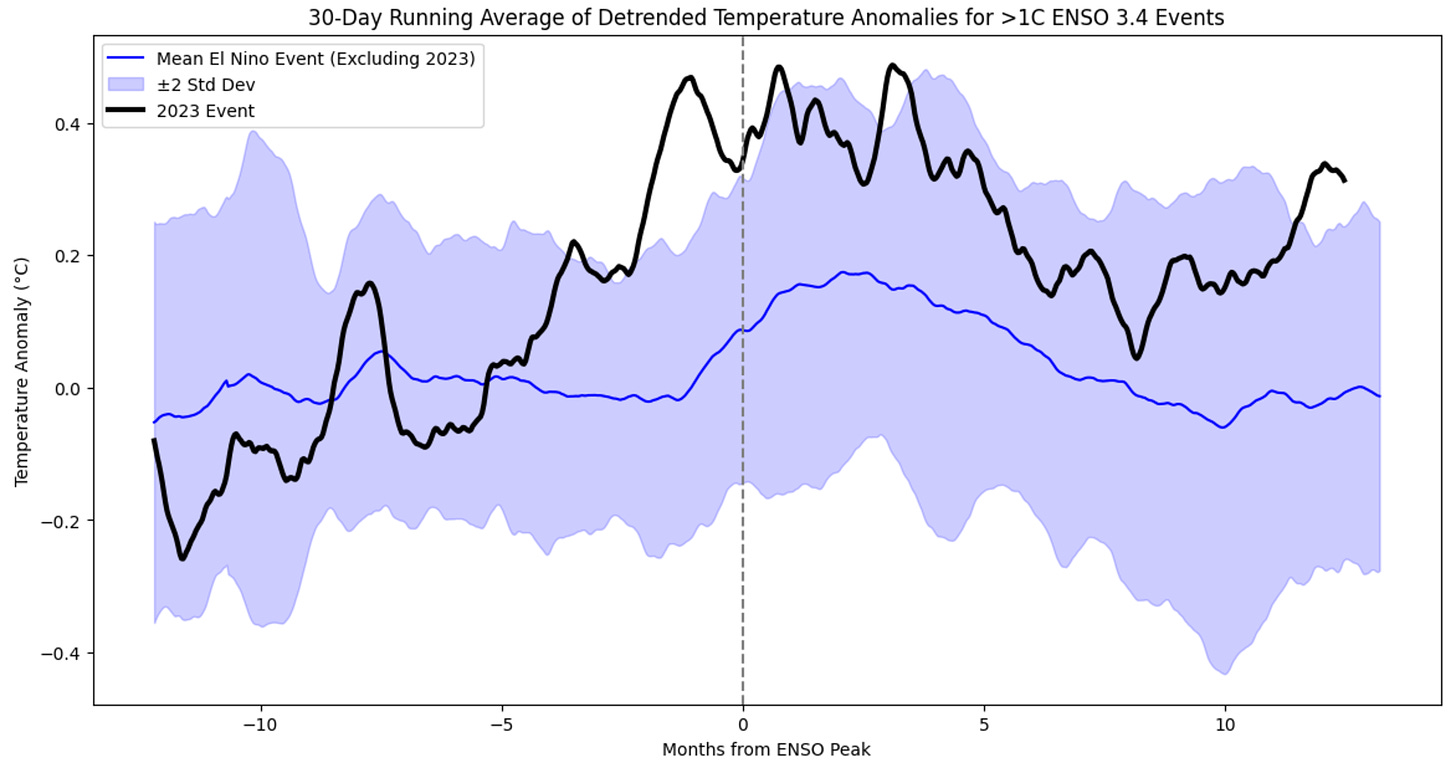
So what is the takeaway here? The weirdest aspect of the 2023/2024 El Niño event remains its early rise in global temperatures, occurring months before the peak of El Niño conditions. The persistence of high temperatures has been unusual, though there is at least one other El Niño event (that of 1958) that shows something slightly analogous. However, despite the December spike in 1958, that El Niño event was by and large well below the elevated temperatures experienced over the past two years.