When you’re selling on Amazon, knowing some Amazon statistics is vital. As the old saying goes, information is power!
Well, get ready to feel more powerful as we show you the top Amazon statistics and Amazon sales data that you need to know about. Once you know them, you can use them to your advantage in your business decisions. Thank us later!
1. Amazon’s Share of the US Ecommerce Market is 37.8%
Take a dive into the Amazon statistics, you’ll find the platform boasts an inventory of about 12 million items across all its categories and services. When you look at all the items that Marketplace sellers list, that number expands to about 350 million. Of all the Amazon statistics, this one highlights that there is a lot of competition — but with that comes a lot of visibility and sales, too.
Amazon sales data reveals that it was responsible for 37.6% of US eCommerce spending in 2023, says According to Statista. What’s more, that figure is expected to rise by another 11.7% by the end of 2024, though we’ll be well into 2025 before the official figures come out.
2. Amazon’s Net Revenue Continues to Grow
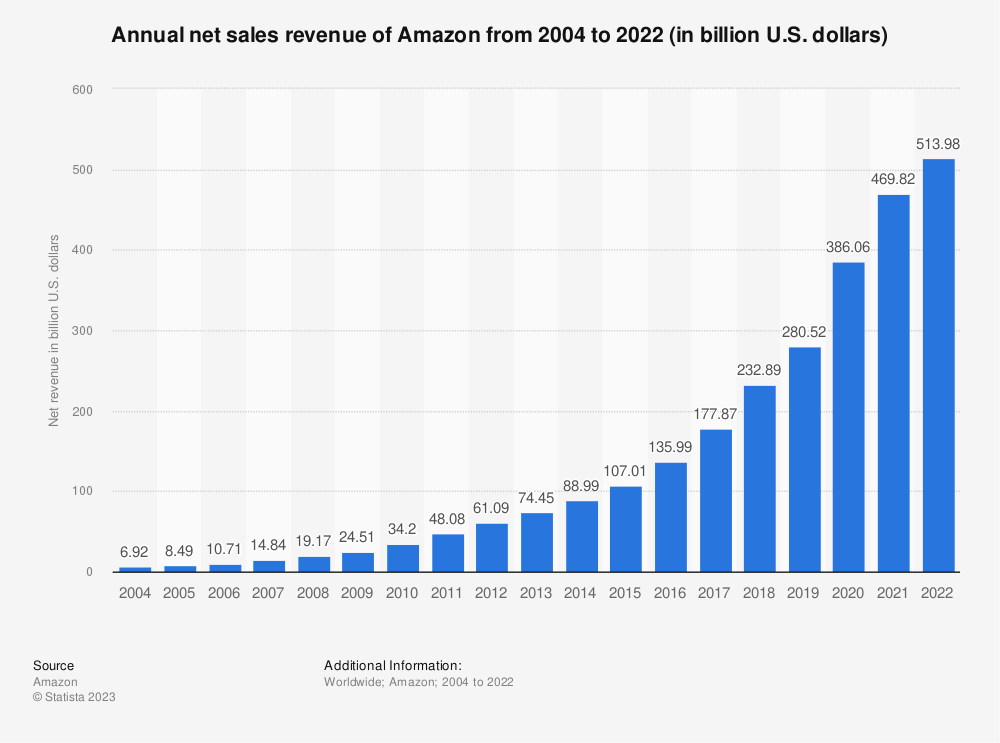
Amazon’s net revenue increased by over $40 billion year-on-year, from $513.98 billion in 2022 to $554.02 billion in 2023. These Amazon sales statistics tell the story loud and clear about the platform’s consistent dominance in eCommerce.

3. The US marketplace is still the highest-performing
It’s not surprising that Amazon started its journey in the United States, as this is where Jeff Bezos originally founded the company. Since then, Amazon has expanded globally, encompassing 21 marketplaces.
Amazon stats reveal that following the U.S., the highest-earning Amazon marketplaces are in Canada, the UK, Mexico, and Germany, with France also being a close contender.
4. Prime Members Spend a Lot
There are over 200 million Amazon Prime members around the world (outnumbering non-Prime shoppers), and they typically spend over $1,000 a year. This might be an extra incentive to fulfil with Amazon, or at least make your items Prime-eligible.
For those without a Prime membership, they tend to spend a little less freely than their Prime counterparts. About three-quarters of non-Prime shoppers spend between $100 to $500 a year on Amazon.
5. Almost 1 in 3 Americans Have a Prime Membership
The US Amazon Marketplace is a huge one, with over 148 million Americans claiming a Prime membership, according to Amazon statistics. They make up over two-thirds of Amazon’s total US audience. These Amazon sales data insights demonstrate how vital Prime-eligible products are for success on the platform.
6. Third-party sellers make up the majority of total Amazon sellers
Around the world, close to 2 million small and medium-sized third-party businesses engage in selling on Amazon. As of 2023, Amazon statistics show that approximately 70% of these sellers operate as independent third-party (3P) sellers, utilizing Amazon’s Seller Central platform.
7. Millennials Are the Biggest Audience
Millennials might get a bad rap in some areas, but not when it comes to using Amazon. They outpace Baby Boomers by a ratio of two to one for using Amazon as a shopping tool. This trend in Amazon sales data tells us about the growing importance of targeting younger demographics.
8. Amazon is Taking Over Traditional Brick-and-Mortar Categories
One of the biggest changes in shopping behaviour is the home improvement industry. Before, buyers would head to their local hardware store and have a pro help them pick out products in person, but as confirmed by Amazon statistics, the platform’s 1.1 million home improvement items display a clear shift away from offline shopping in that area. Amazon sales statistics confirm this significant shift towards online retail dominance.
9. Almost Everyone Price Checks on Amazon

Amazon almost always jumps to the tops of shoppers’ list for price checking, and Amazon stats reveal that 9 out of 10 shoppers checking out the marketplace for what the best deals are. When consumers do that, it’s because they’re looking for the best all-around package of price, customer service and shipping speed.
Related: Best Amazon Price Trackers
10. Black Friday and Cyber Monday Are Profitable, But Not THE Most Profitable Shopping Days
If you’re looking for a massive boost in sales, Prime Day is the one to circle on your calendar. Not only do more people sign up for Prime memberships on that day than any other, but they also convert (18.6%) and spend the most, too. More than both Black Friday and Cyber Monday. In 2023, Prime Day sales reached an estimated 12 billion U.S. dollars worldwide according to Amazon sales data, making it the most successful shopping occasion in Amazon’s history.
11. FBA is still the top fulfilment choice for Amazon sellers
It’s widely accepted that utilizing Amazon’s fulfillment methods, such as Fulfillment by Amazon (FBA), can definitely expedite the achievement of your sales goals and increase the likelihood of winning the Buy Box — and the Amazon seller statistics back this up. Because Amazon has complete confidence in its internal operations, so do sellers. Amazon sales statistics show that approximately 86% of sellers opt for Fulfillment by Amazon (FBA) as their chosen method of selling.
12. Alexa Isn’t Quite the Instant Buying Tool Yet

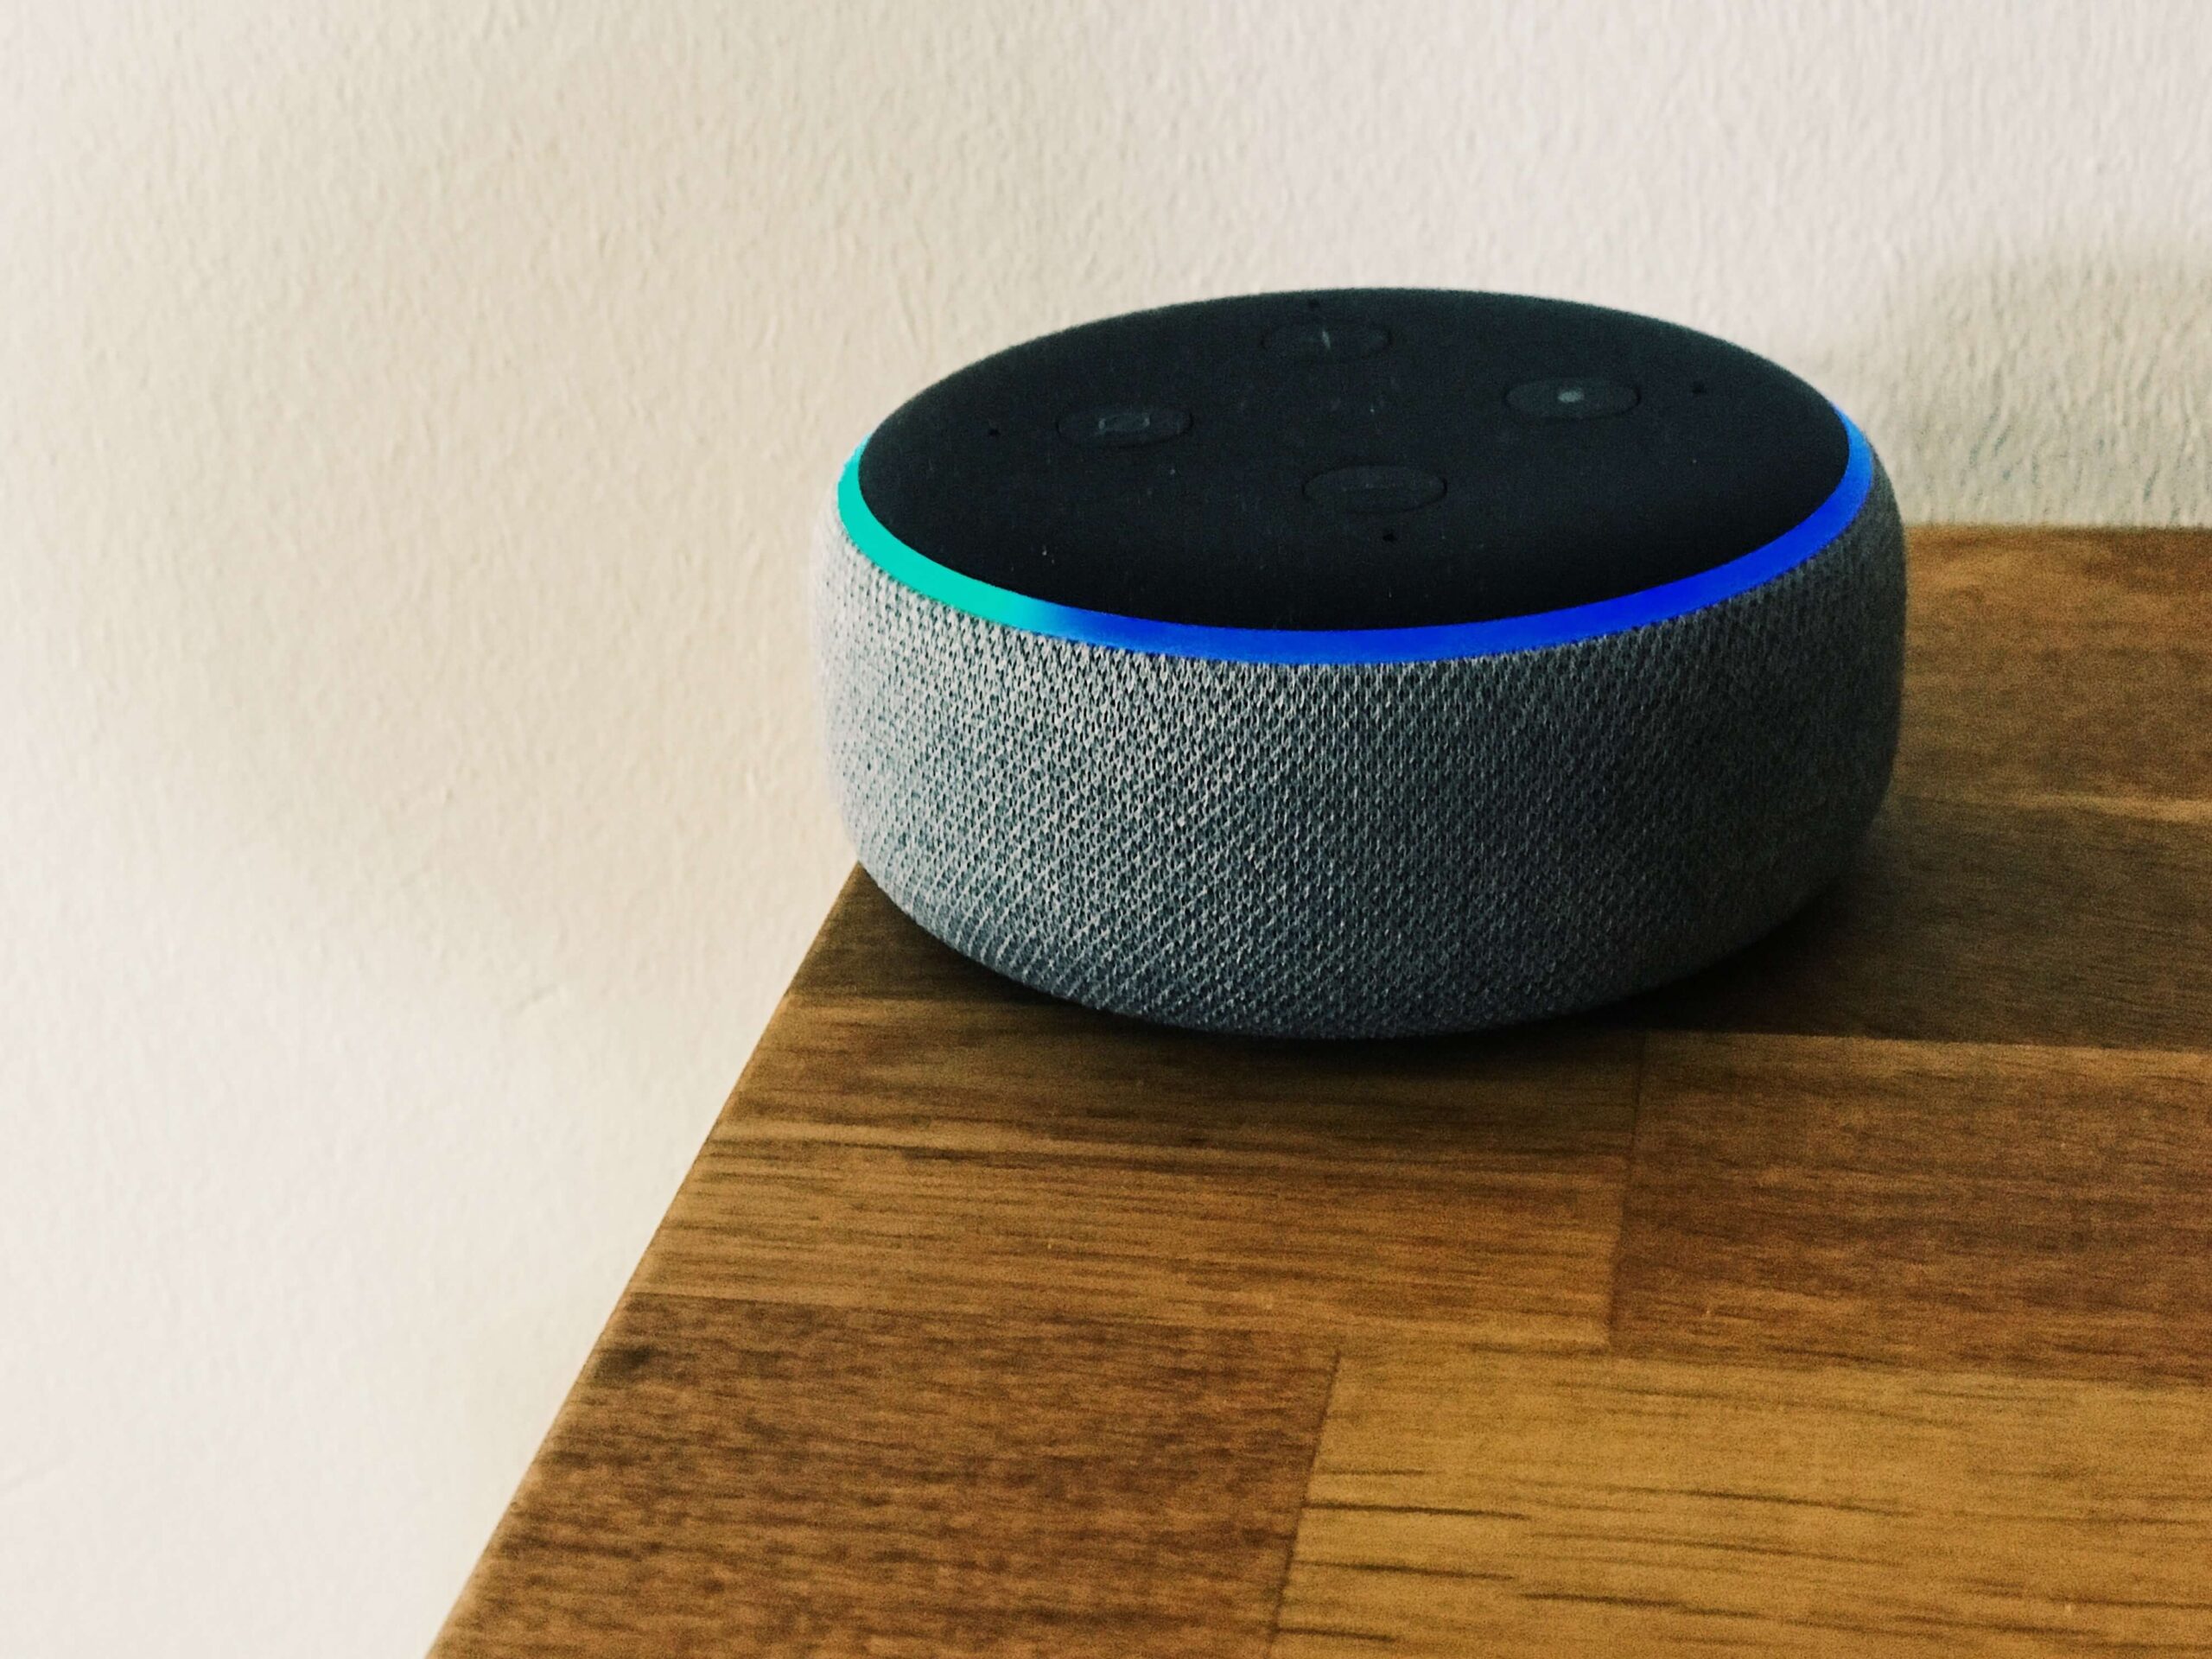
Although half a billion Amazon Echos have been sold since they were released in 2015, they’re not yet being widely used for purchases. Users ask Alexa questions and check on order statuses, but only about 2% of them use Alexa for making new purchases. It shows that users still highly value seeing products and reading about them before purchasing them.
13. But Alexa Can Still Do a Whole Lot
In the few years she’s been around, Alexa has picked up over 30,000 skills and can control more than 4,000 home devices. She’s also steadily improving her English language skills at an astronomical rate each year, registering a 25% leap in just the last year.
14. Amazon Sales Per Second, Minute and Hour
- Each second, Amazon records $4,722.
- Each minute, those sales amount to $283,000.
- And in an hour, that averages more than $17 million.
Pretty jaw-dropping, right?
15. Every Minute Counts When the Website Goes Down
In August 2013, Amazon was down for 40 minutes. And in that short time-span, they had almost $5 million in lost sales. With Amazon sales data showing $15.7 billion in revenue for the previous quarter, this equates to an average of $120,000 lost every minute during downtime.
16. Most Sellers Branch Out on Different Platforms
Approximately 80% of Amazon sellers use additional platforms to expand their reach, driven by Amazon sales data showing heightened competition and the rise of private-label brands. Diversification helps sellers secure a steady income and reduces reliance on a single marketplace, ensuring they don’t put all their eggs in one Amazon basket.
17. Global Digital Buyers Continues to Rise
In 2021, over 2.14 billion people worldwide are expected to buy goods and services online, up from 1.66 billion global digital buyers in 2016, according to Statista and Amazon statistics. The growth evident in this Amazon sales data reflects the expanding opportunity for eCommerce platforms like Amazon to capture an ever-increasing share of the global market.
18. There are close to 4,000 new sellers every day on Amazon
In 2021, 3,700 new sellers were starting a business on Amazon. 26% of those new sellers are from the US with over 10% located in India.
19. There Were 350,000 Sellers With Over $100,000 in Sales in 2021
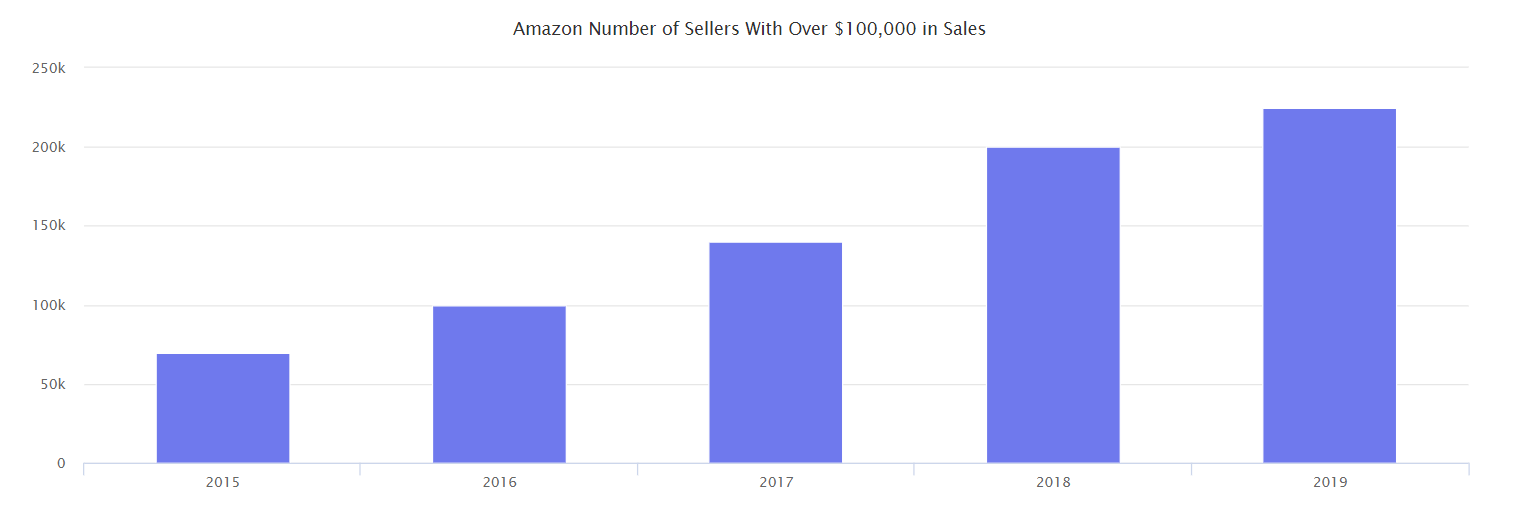
In 2021, Amazon reported 350,000 sellers worldwide earning over $100,000 annually, a 55% increase from 225,000 sellers in 2019. Meanwhile, more recent Amazon seller statistics reveal that 47% of small and medium-sized sellers have surpassed this milestone in their lifetime sales, reflecting the platform’s ongoing opportunities for profitable growth.

Image credit: Marketplace Pulse
20. Profit margins for Amazon sellers are on the rise
In 2023, 57% of Amazon sellers reported profit margins exceeding 10%, while 28% of sellers achieved over 20%, according to Jungle Scout. Nearly three-quarters (73%) of Amazon sellers make a profit margin of more than 10%, and over a third (35%) achieve more than 20%. This is high compared to the usual 7% to 10% profit margin for small businesses in the U.S.
In 2022, Amazon seller statistics highlighted sellers’ profit boosts, with 89% making a profit, up from 85% in 2021. Even with inflation affecting costs and consumer spending, 37% of sellers reported higher profits in 2023.
Final Thoughts
These Amazon seller statistics are super useful to know — and yet, they’re just the starting point.
Stay competitive on Amazon means understanding key Amazon statistics and using tools. That is how you can make data-driven decisions, which in turn is how you can keep on top of pricing your products to compete with other sellers.
Without Amazon stats, the critical process can fall flat. But speed is another essential here.
So, instead of doing manual pricing, let Repricer help you to win the battle of timely price changes. We’ll help you increase sales and profits, as well as upping your chances of snagging that all-important Buy Box. Check it out by with a free 14-day trial today.
Related: Amazon Has 1,029,528 New Sellers This Year (Plus Other Stats)
