Reason to trust
![]()
Strict editorial policy that focuses on accuracy, relevance, and impartiality
Created by industry experts and meticulously reviewed
The highest standards in reporting and publishing
Strict editorial policy that focuses on accuracy, relevance, and impartiality
Morbi pretium leo et nisl aliquam mollis. Quisque arcu lorem, ultricies quis pellentesque nec, ullamcorper eu odio.
Este artículo también está disponible en español.
In an X post shared earlier today, crypto analyst Ali Martinez noted that Bitcoin (BTC) is flashing a buy signal. Another analyst, Titan Of Crypto, highlighted that BTC is currently trading in a reversal zone – suggesting that the leading cryptocurrency may soon experience a shift in price momentum.
Bitcoin Flashes Buy Signal Amid Market Pullback
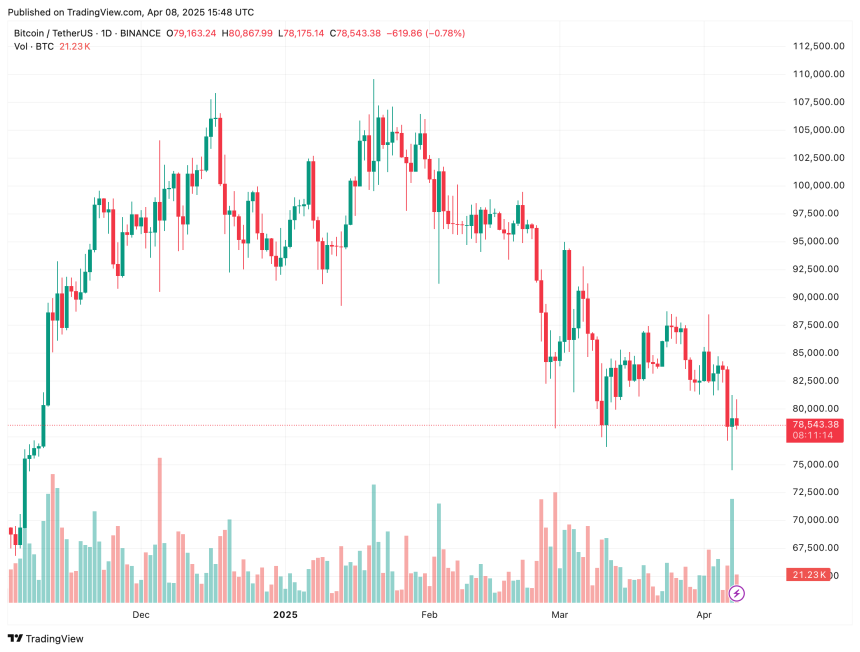
Compared to the price action seen last year, Q1 2025 has been relatively sluggish for digital assets. On a year-to-date (YTD) basis, BTC is down nearly 30%, dropping from around $97,600 on January 1 to approximately $78,000 at the time of writing.
Related Reading
Following yesterday’s tariff-induced crypto market pullback – which wiped over $140 billion from the total crypto market cap – BTC is now beginning to show early signs of strength. Martinez emphasized that Bitcoin is flashing a weekly TD Sequential buy signal.
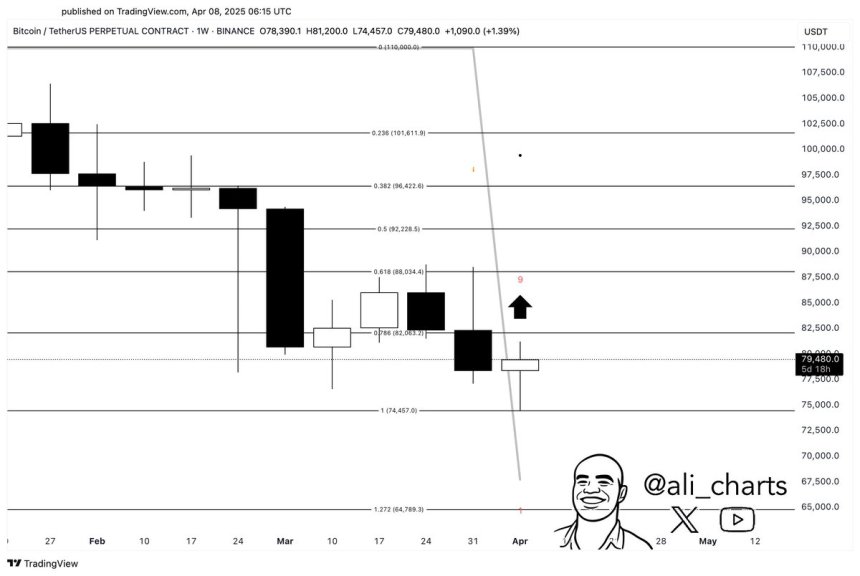
For the uninitiated, the weekly TD Sequential buy signal is a technical indicator that suggests a potential trend reversal or buying opportunity after a prolonged downtrend. It typically appears when a specific 9-count pattern completes, signalling that selling pressure may be exhausted and a price rebound could be near.
Meanwhile, fellow crypto analyst Titan Of Crypto pointed out that BTC is trading within a potential reversal zone. He noted that as long as BTC remains above the 38.2% Fibonacci retracement level, the broader uptrend would remain intact.
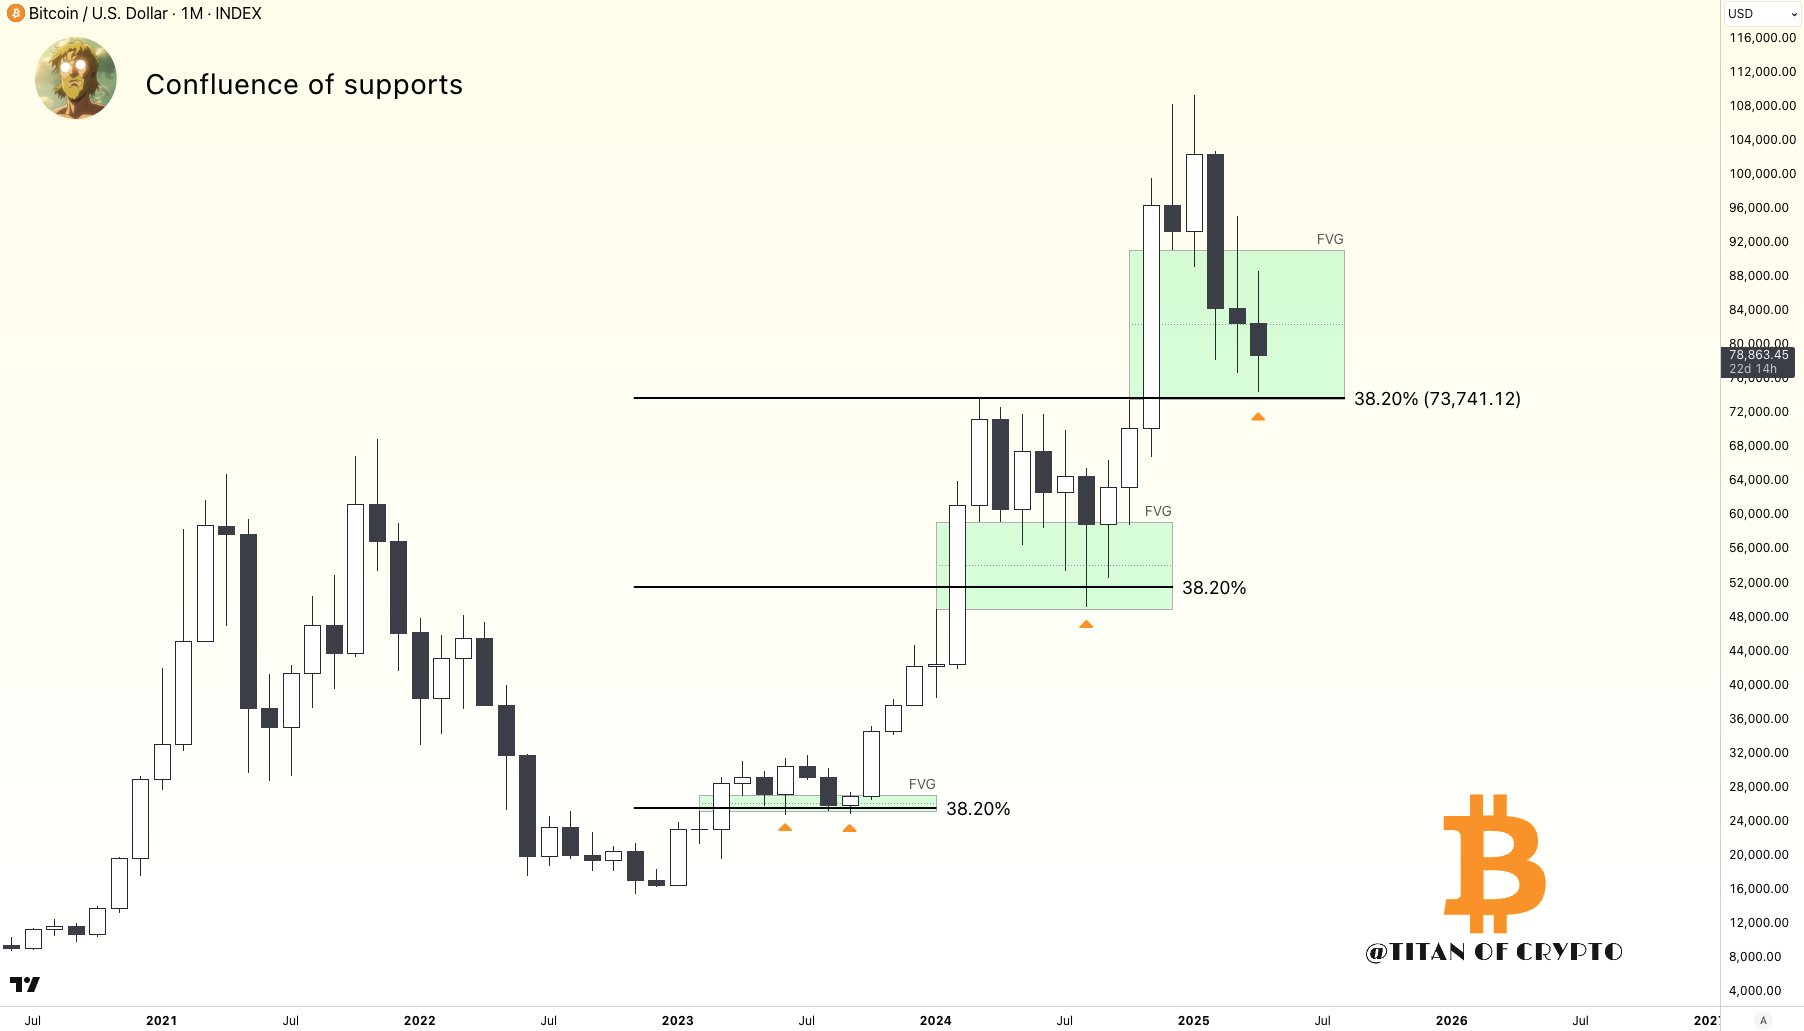
Additionally, Titan highlighted that BTC’s Fair Value Gap (FVG) at $80,000 has now been filled – a development that further boosts the case for a potential trend reversal or significant price action at current levels.
To explain, an FVG is a price imbalance on a chart, often created by a strong move in one direction, where little to no trading occurred. It indicates a potential area where price may return to “fill the gap” before continuing its trend.
Recent BTC Price Drop Not Out Of The Ordinary
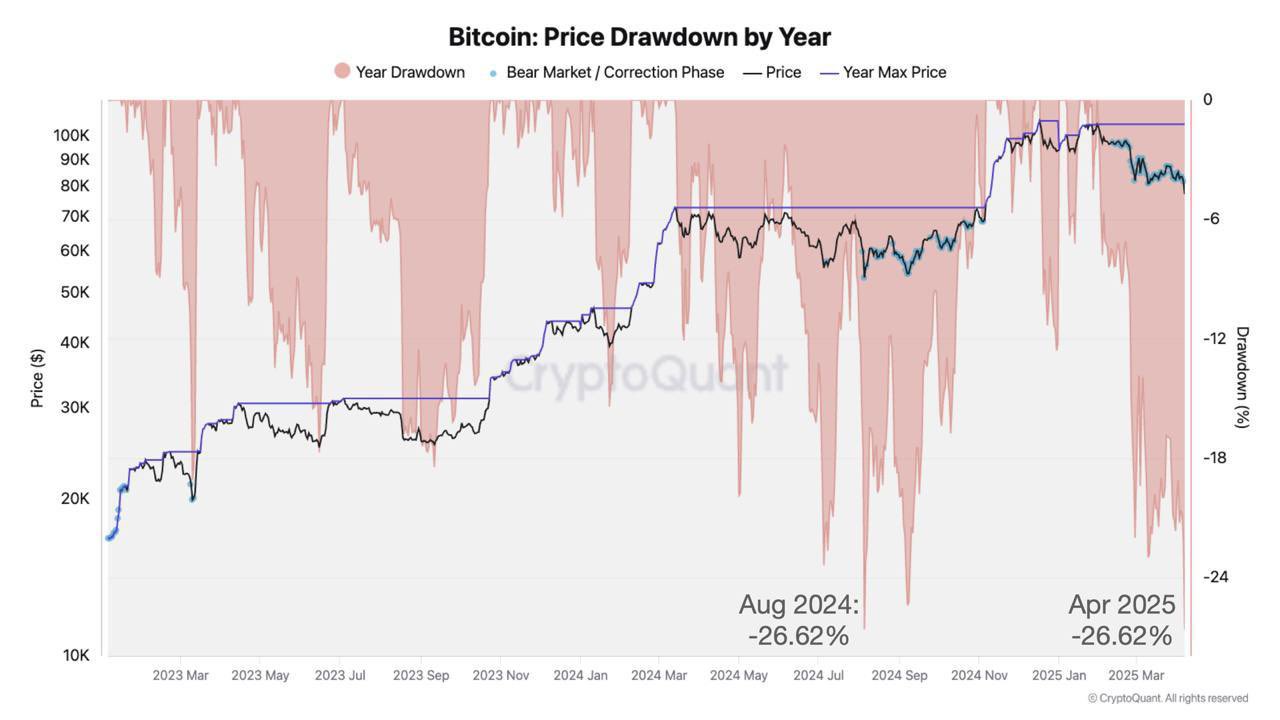
Another crypto analyst, Master Of Crypto, remarked that although the recent BTC price decline may have alarmed some investors, it’s well within the bounds of historical norms. The analyst pointed out that BTC is currently trading about 26.6% below its all-time high (ATH) of $109,500.
Related Reading
However, this decline is still less severe than previous market cycle drawdowns, such as 83% in 2018 and 73% in 2022. The analyst added that besides the price pullback, BTC’s weekly Relative Strength Index (RSI) has also been trending down for five weeks.
That said, technical indicators suggest that it may take more time before BTC sees a meaningful shift in price momentum. For instance, the top cryptocurrency recently flashed a death cross, a bearish pattern that could signal further short-term downside. At press time, BTC trades at $78,543, down 0.3% in the past 24 hours.
Featured image from Unsplash, Charts from X, and TradingView.com